Resultados Prueba Comprensión Lectora Inicial
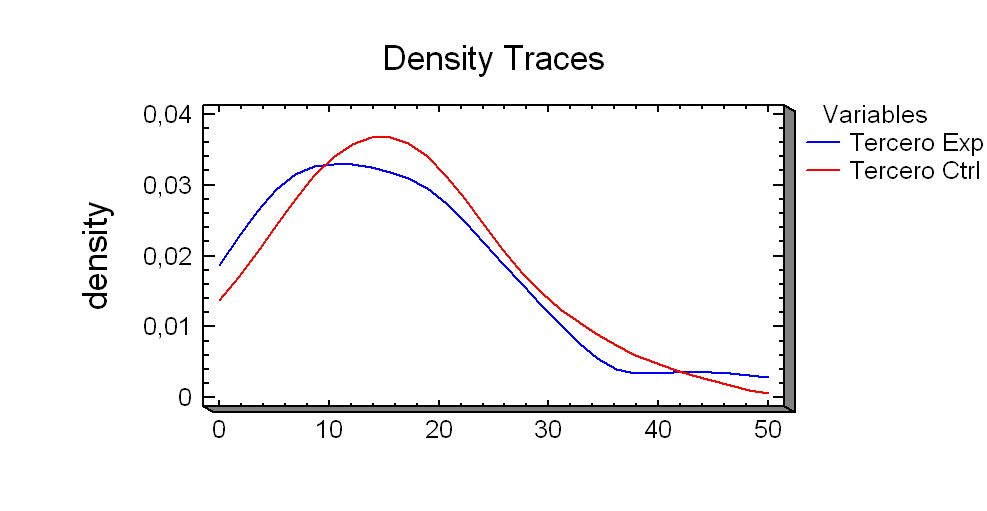 La presente gráfica compara los resultados obtenidos por el grupo experimental y el grupo control en la prueba inicial de comprensión lectora, efectuada en marzo.
El siguiente análisis estadístico, así como la gráfica, fueron obtenidos utilizando el software Statgraphics Plus 5.1
Summary Statistics
Tercero Exp Tercero Ctrl
------------------------------------------------------------
Count 35 35
Average 15,3571 16,0357
Variance 134,349 96,6214
Standard deviation 11,5909 9,82962
Minimum 0,0 0,0
Maximum 50,0 40,0
Range 50,0 40,0
Stnd. skewness 2,61492 1,15058
Stnd. kurtosis 1,75607 0,101777
Aquí observamos que el grupo experimental obtiene una media o promedio de 15,3571 frente a un 16,0357 del grupo control. Sus respectivas desviaciones estándar son: 11,5909 y 9,82962.
El análisis de la hipótesis nula, utilizando Statgraphics, muestra los siguientes resultados:
Sample mean = -0,678571
Sample median = 0,0
t-test
------
Null hypothesis: mean = 0,0
Alternative: not equal
Computed t statistic = -0,288792
P-Value = 0,774494
Do not reject the null hypothesis for alpha = 0,05.
sign test
---------
Null hypothesis: median = 0,0
Alternative: not equal
Number of values below hypothesized median: 17
Number of values above hypothesized median: 17
Large sample test statistic = 0,0 (continuity correction applied)
P-Value = 1,0
Do not reject the null hypothesis for alpha = 0,05.
signed rank test
----------------
Null hypothesis: median = 0,0
Alternative: not equal
Average rank of values below hypothesized median: 20,1176
Average rank of values above hypothesized median: 16,8824
Large sample test statistic = 0,0 (continuity correction applied)
P-Value = 1,0
Do not reject the null hypothesis for alpha = 0,05.
Los tres test aplicados mediante Statgraphics indican que no existe ninguna diferencia significativa entre el grupo experimental y el grupo control, luego de aplicarse la prueba inicial de comprensión lectora, en el mes de marzo.
Escrito por Ruth Lucena Santos Otero @ 1:12 a. m.
0 comentarios
![]()

0 Comments:
Publicar un comentario
<< Home